Monitoring a Portfolio of Company Assets
Motivation
This demonstration covers a simplified (educational) example of monitoring the latest events associated with a publicly traded company. An API connector is used to collect data from a specific company (recent news, management team), which is then semantically analyzed using LLMs (e.g., sentiment analysis), post-processed (generated visualizations), and all results are output into a report.
One-Shot Reports
This demonstration showcases the concept of a one-shot report, where a generative AI expert agent performs various analytical tasks that are aggregated into a single report. Many analytical tasks aim to produce a document that builds an evidence/data-driven argument to support downstream decision-making.
Lunar integrates this concept into its architecture, allowing the end-to-end organization of the analytical cycle from data source collection to communication of results. While some reports can be fully automated, Lunar users commonly treat one-shot reports as a first draft, which concentrates all relevant evidence into a single point of access and performs preliminary analytical processes.
Workflow Overview
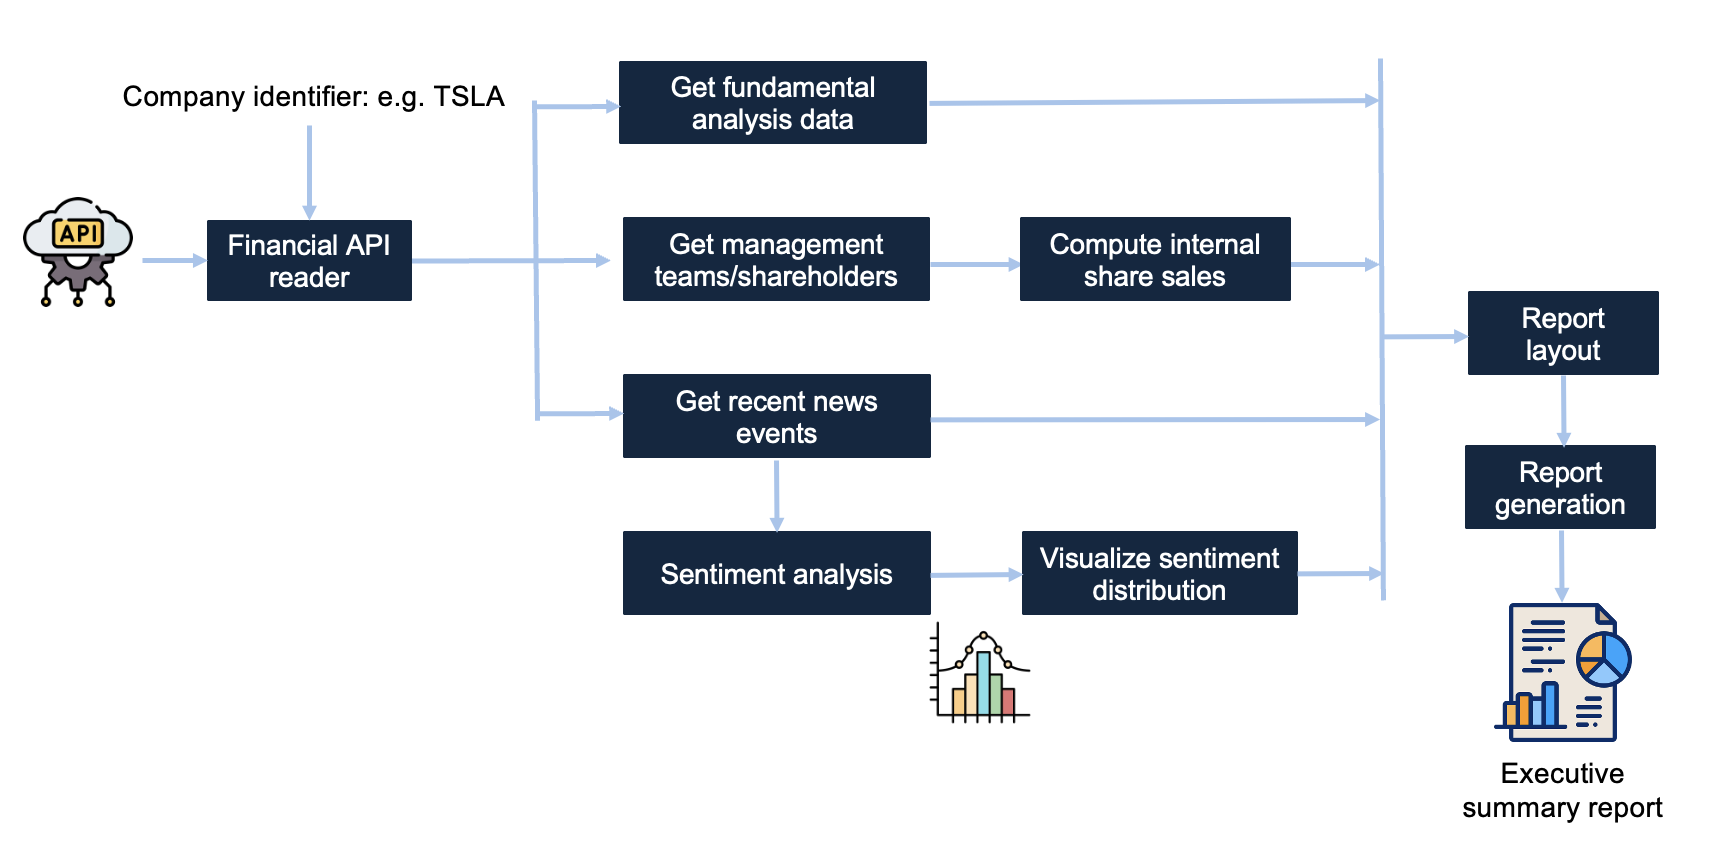
In this example workflow, the Yahoo Finance API is used to collect basic company data for a specified company. Given the stock identifier as an input parameter, the workflow starts by using an external finance API to collect fundamental, shareholder, management team and event data for a target company. News events are aggregated using an LLM-based sentiment analysis and then visualized into a barchart plot. Shares of the management team are computed and summarized. A final report is structured and made available to end users. The figure below outlines the main components.
Demonstration
Watch the video below to see what the actual workflow looks like.
Contributors
This workflow was developed by Alex Bogatu.